HLS monitoring · managed service
Know why the buffer ran empty.
Most monitors fetch your playlist and check for a 200. signalmonitor.app plays your stream from every region your viewers are in — real segments, real bitrate adaptation, a real playback buffer — and tells you what broke and where.
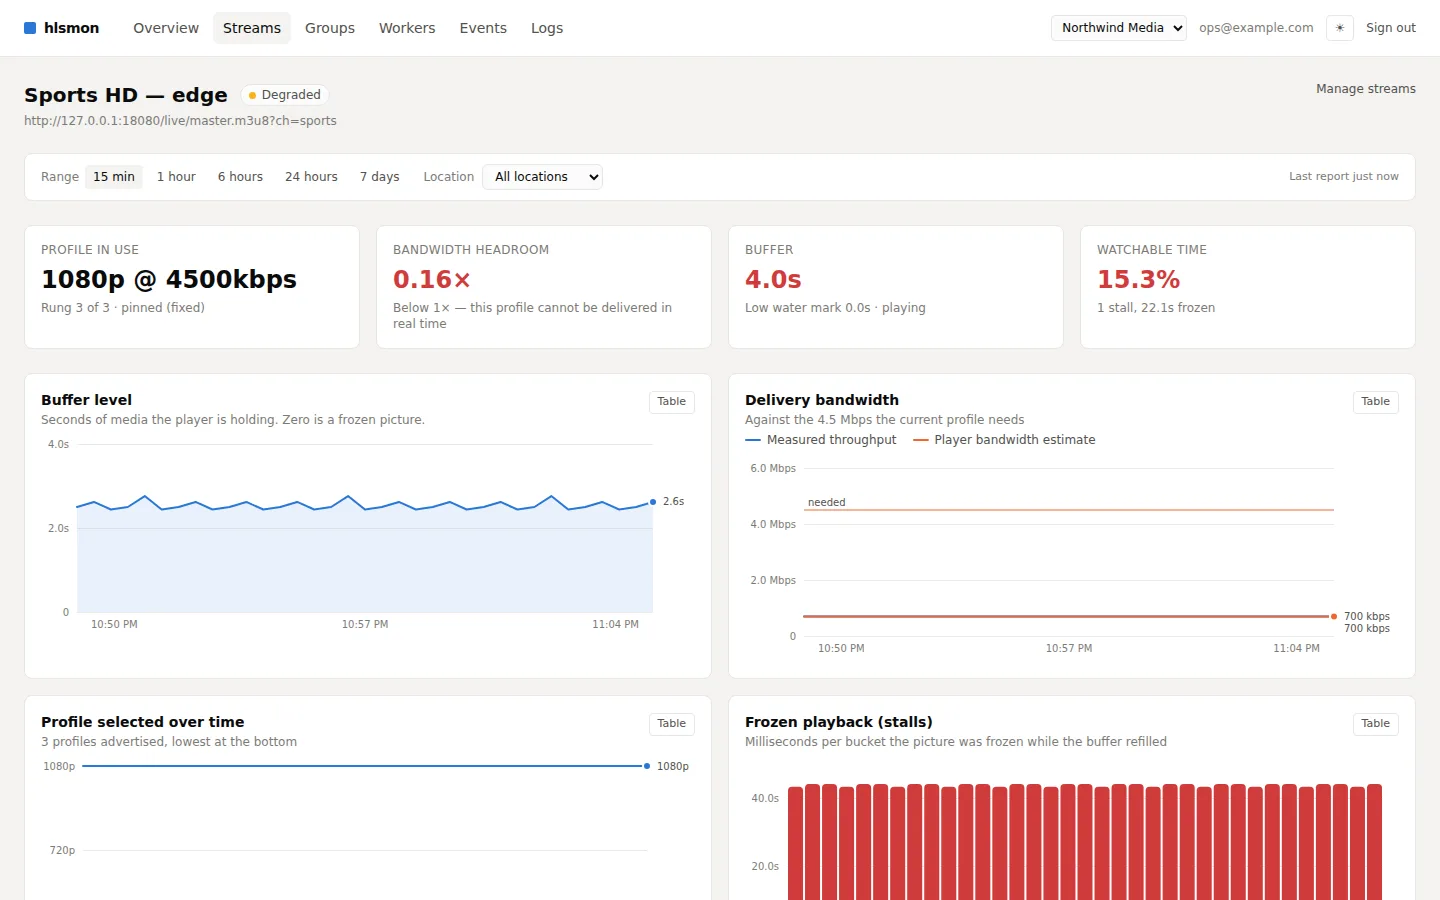
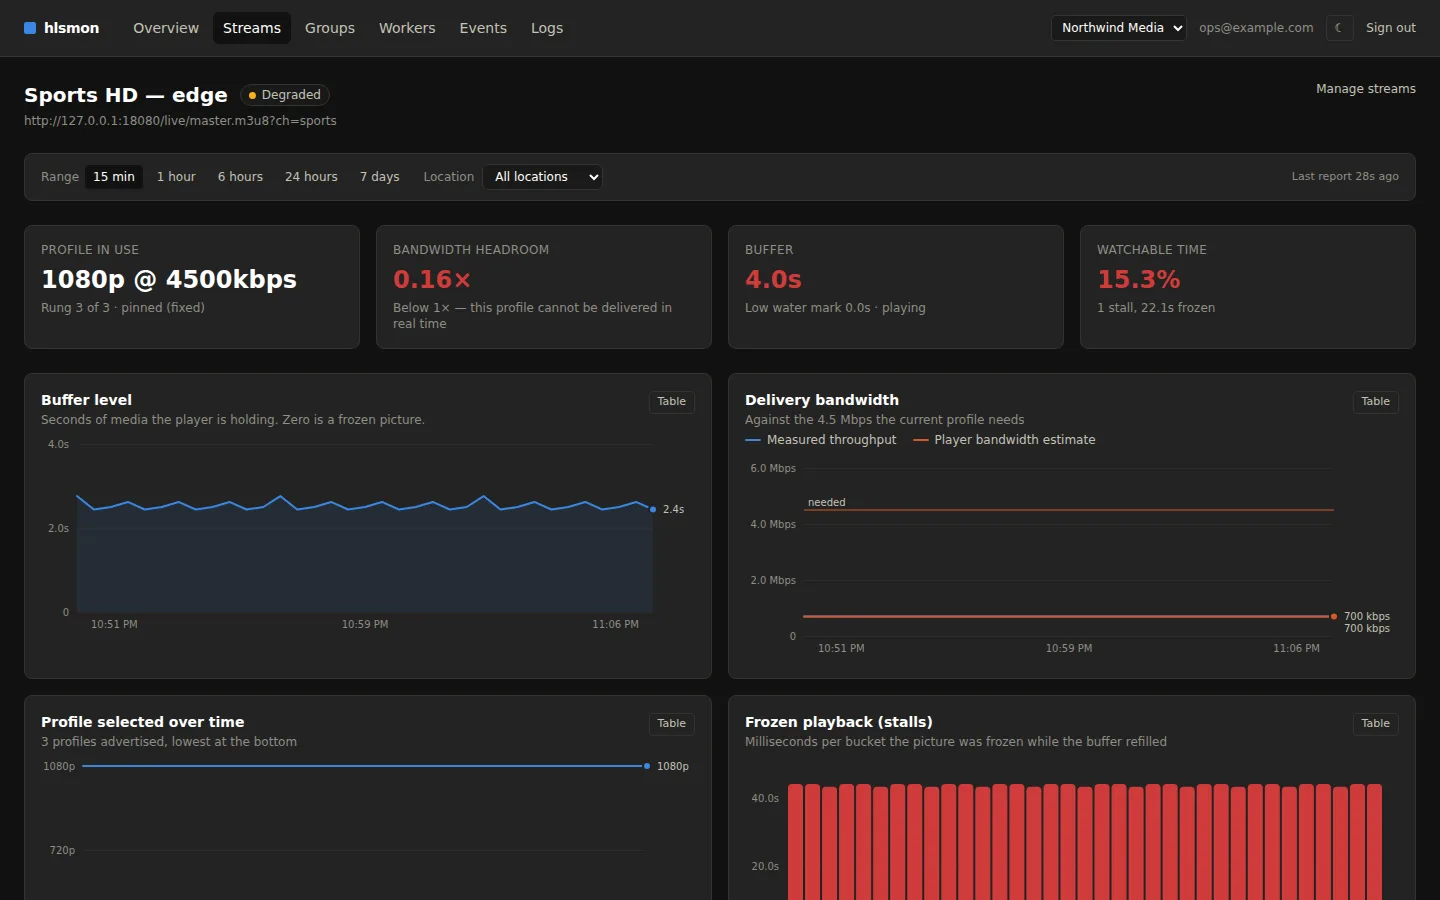
An alarm says “degraded”. This says why.
When the modelled buffer reaches zero, the worker already holds everything needed to explain it: the rung it had selected, the bandwidth it was seeing, the segment it was waiting on, the playlist’s freshness, the latency to the edge. The stall is classified from those, and the numbers travel with the verdict — so you can check it rather than trust it.
Causes: not enough bandwidth · slow origin or cold cache · publisher stopped advancing · failing segments · gap segments · DNS · TLS · connect · timeout.
Available throughput was 700 kbps against the 4500 kbps this rung needs (84% short), delivering only 0.16× real time, so the buffer drained from 3.6 s to empty.
Throughput between this location and the edge is insufficient for the selected rung. Check the CDN path from this region and whether the ladder has a low enough bottom rung.
- Profile playing
- 1080p @ 4500 kbps
- Buffer before
- 3.6s
- Delivery
- 0.16× real time
- Segment fetch
- 200 in 12.9s
- CDN cache
- HIT
- Latency
- 0.2 ms
The whole thing, in six screens
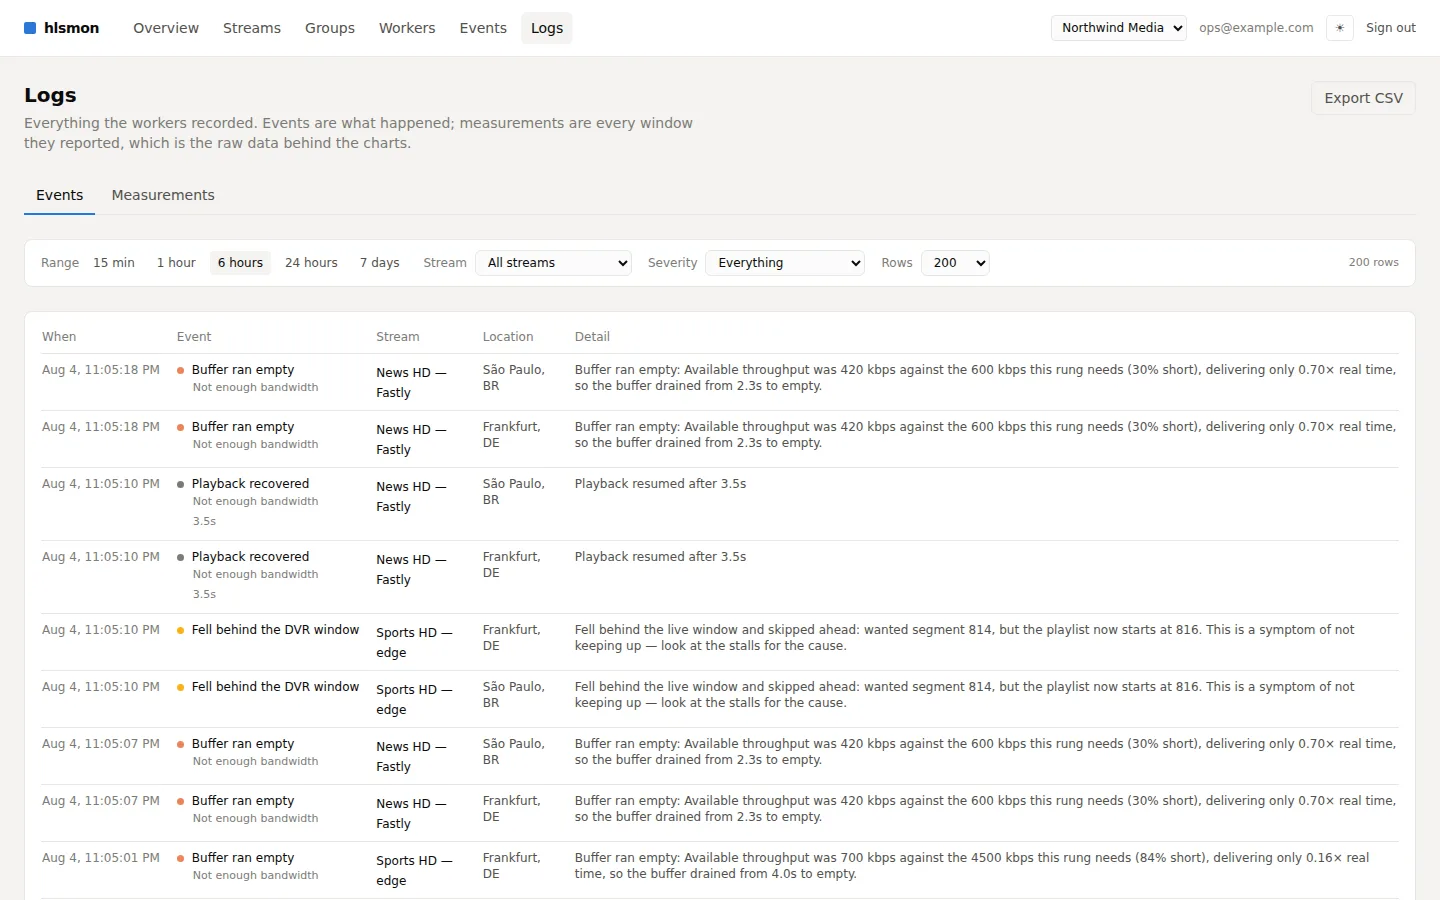
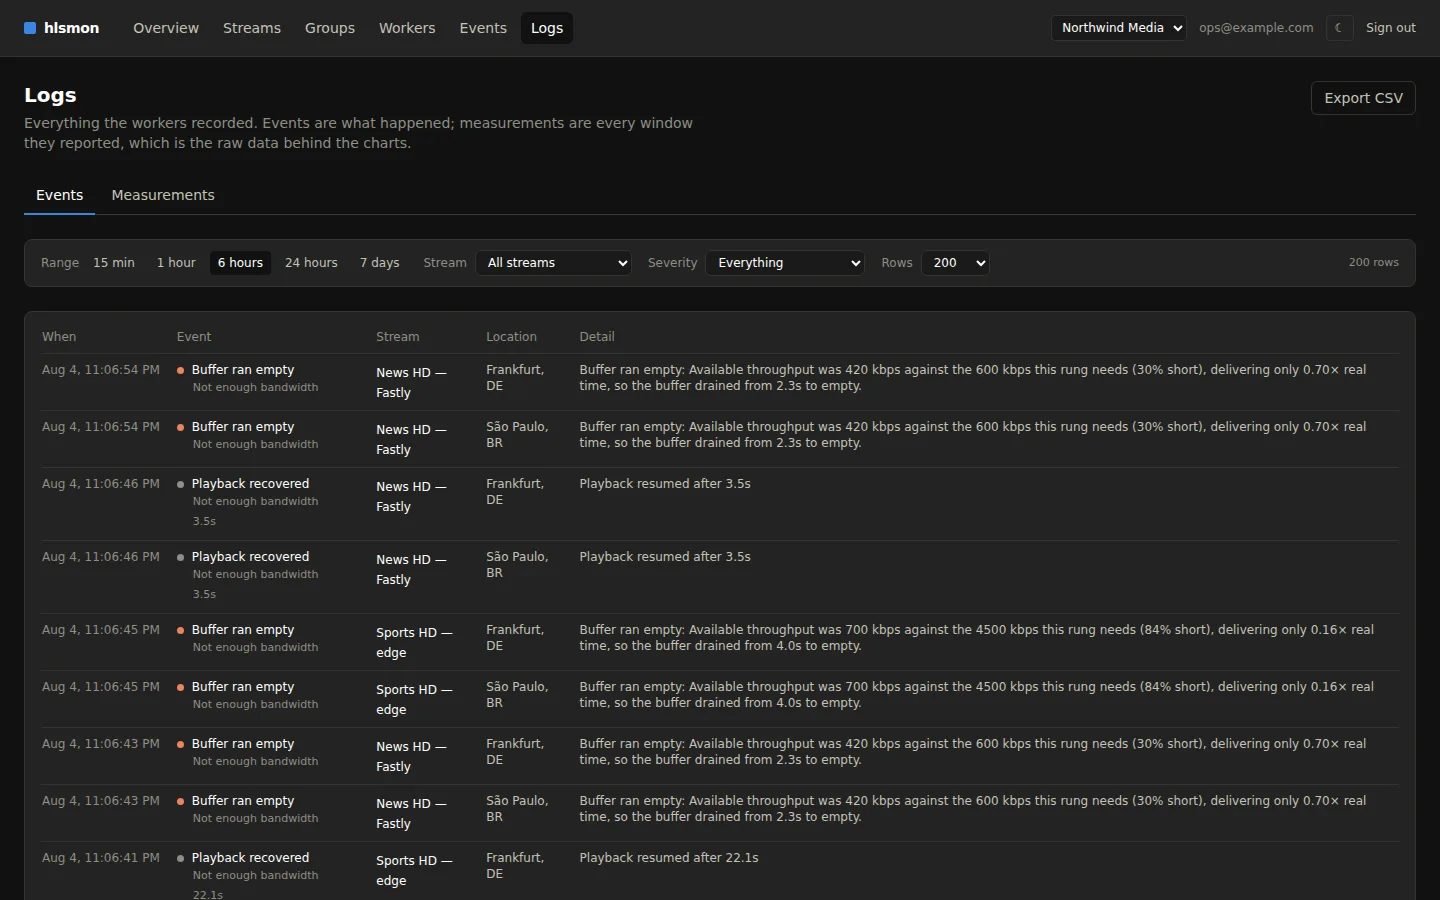
Nothing here is a mockup. These are the views a worker fills in within a minute of being installed.
What a manifest check cannot see
Because the worker behaves like a player, it observes the things that actually cost you viewers.
Buffer starvation, timed
A modelled playback buffer drains against the wall clock, so a stall has a real start and a real duration — not an inference from a slow response.
A named root cause
Every stall is classified: not enough bandwidth, slow origin, a publisher that stopped advancing, failing segments, DNS, TLS. With the numbers behind the claim.
The profile viewers really get
Adaptive bitrate is simulated the way browsers do it, so you see which rung of your ladder each region could actually play, and every switch with its reason.
Frozen encoder vs slow CDN
A playlist returning 200 while the live edge has not moved for four minutes looks healthy to an HTTP check. signalmonitor.app distinguishes that from a client that cannot keep up.
Origin and every CDN, side by side
Group one channel’s origin URL with each CDN URL. Same locations, same window, one table — so “is it us or the CDN?” stops being a guess.
Ladder conformance, continuously
A rung that declares 5 Mbps and delivers 8 makes every player’s ABR decision wrong. signalmonitor.app compares declared BANDWIDTH against what really arrives.
Three steps
Add a stream
Paste a master or media playlist URL. Choose whether the monitor adapts bitrate like a real player or stays pinned to one rung.
Install a worker where your viewers are
One command per region. It enrols itself, asks what to watch, and reports back over outbound HTTPS only.
Watch, and get told why
Buffer, bandwidth, latency and profile graphs per location, a full log of every measured window, and a diagnosis attached to every stall.
Installing a worker in your location
Sign in and open Workers in the dashboard to get a one-line install command with your own enrolment token — Docker, Compose, systemd and plain-binary variants are generated for you.
A worker only makes outbound calls and measures from wherever you run it, so a stream is tested from the regions your viewers are actually in.
What it does not do
signalmonitor.app measures segments as byte streams and never decodes them, so it cannot check keyframe alignment across renditions, audio/video sync, or dropped frames. It is synthetic, so it will not tell you that one ISP’s set-top boxes are struggling — pair it with player-side analytics for that. Its metrics follow CTA-2066 naming so the two sit on the same chart.
A monitoring tool that overstates its coverage is worse than one that names the gap.
See it on your own stream
Add a playlist URL, install one worker, and you will have buffer and bandwidth graphs within a minute.